
|
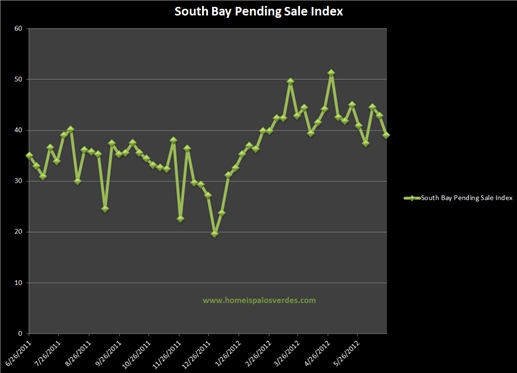
Palos Verdes home prices are trending up. But this article published by “Realtor®Mag” doesn’t get the whole story, in fact I think they’re missing more than half the point. Sure, interest rates being as low as they are clearly help home sales. But when they report "Tim Iacano of Iacano Research credits the majority of the recovery and rise in home prices—if not all of it—to the Federal Reserve’s aggressive actions to keep mortgage rates low. The Fed’s quantitative easing (QE) program has prompted mortgage rates to fall to all-time lows in recent weeks.” they are missing a critically important law of economics. They don’t even talk about the issue SUPPLY & DEMAND. Interest rates are so low, that even if they were to go up 1-2 percent, they would still be incredibly low relative to decades long historical standards. So it can’t be that low interest rates are sole driver let alone major contributor as Mr. Iacano would have us believe. While I can’t speak for a national real estate market, I can certainly provide you hard fact documentation on Palos Verdes home prices and what is happening with the supply & demand dynamic for Palos Verdes homes as well as for the Greater South Bay area. Let’s take a look at what’s happening. Palos Verdes Home Prices trends are patterning this chart on the South Bay
You can email me for a larger copy of this chart if you wish. The red trend line shows the volume of Pending Sales going back to May of 1990 (yes, I keep track), the blue line tracks the New Listing Volume. Think of Pending Sale Volume as a measure of demand and think of New Listing Volume as a measure of supply. Clearly, it’s starkly evident, the number of new listings coming to market is the lowest it’s been in nearly 20 years! At the same time that supplies have been dropping of Palos Verdes homes and other homes around the South Bay, demand has been picking up. We all know what happens when people want more of something, but that something is less and less available. And as you can see by green line, prices indeed have been firming, in fact they’ve been going up. Visit this link to get more information on Palos Verdes Home Prices. |
||
 |
||
Tag Archives: palos verdes real estate trends


Palos Verdes Real Estate Supply & Demand Trends for December 2012
 The latest information on Palos Verdes real estate trends is GOOD. Market data is showing that the supplies of homes are down and demand is up. The latest information on Palos Verdes real estate trends is GOOD. Market data is showing that the supplies of homes are down and demand is up.
This trend of month over month improvement in the supply demand dynamics strongly suggests an improving real estate market. Are you interested in learning more about:
Just send me an email or give me a call, and I will get on it for you! Palos Verdes Real Estate Trends Improving
for a larger view of this chart, please visit http://www.palosverdesrealestatetransactionreport.com/ From 277 days of unsold inventory in the South Bay area (including Palos Verdes homes) to 189 days in one year, is a huge improvement in the market! That’s a 32% increase in the South Bay & Palos Verdes real estate market’s ability to absorb inventory through sale activity. So the question is … supplies down, demand up, what do YOU think that does to prices?
|
||
|
||


Rancho Palos Verdes Homes – Pending Sale Report
|
Pending Home Sales Slip in June, Remain Above a Year Ago The Pending Home Sales Index,* a forward-looking indicator based on contract signings, slipped 1.4 percent to 99.3 in June from a downwardly revised 100.7 in May but is 9.5 percent higher than June 2011 when it was 90.7. The data reflect contracts but not closings. Lawrence Yun, NAR chief economist, said inventory shortages are a factor. “Buyer interest remains strong but fewer home listings mean fewer contract signing opportunities,” Yun said. “We’ve been seeing a steady decline in the level of housing inventory, which is most pronounced in the lower price ranges popular with first-time buyers and investors.” Here’s the data for the Nation:
And looking at the Local South Bay Real Estate Market
and how about for Homes in Palos Verdes Estates
To obtain specialized Palos Verdes Estate real estate trend data as well as real estate trends for all Palos Verdes Homes including real estate in Rancho Palos Verdes and Rolling Hills Estates homes for sale and Rolling Hills property, follow the link in the yellow tab below. Here’s a quick video on the type of information you will find which also includes an interactive map based search product to find homes for sale in Palos Verdes
|
|||||||||||||||||||||||||
| as originally published at http://realestatemarbles.com/homeispalosverdes/2012/07/27/home-sale-trends-in-palos-verdes-estates/ | |||||||||||||||||||||||||
|
|||||||||||||||||||||||||
|
|||||||||||||||||||||||||


Secret Palos Verdes Real Estate Trends
|
There’s now an additional way to get more trend data on Palos Verdes homes for sale so that if you are buying or selling a home in Palos Verdes, you will be better prepared with information that will maximize your interests.
The worst feeling is to not have a roadmap when you’re visiting a strange area. Let my programs be your “GPS” to real estate! Feel welcome to give it a try! Start your search for Homes for Sale in Palos Verdes and start using the Market Trend information today |
|||||||||||||||||||||||||
| originally published at http://realestatemarbles.com/homeispalosverdes/2012/07/26/palos-verdes-real-estate-trends-price-volume-buyer-patterns/ | |||||||||||||||||||||||||
|
|||||||||||||||||||||||||
|
|||||||||||||||||||||||||

Palos Verdes Homes Sales Report compared National Real Estate trends
|
WASHINGTON (July 19, 2012) – Existing-home prices continued to show gains but sales fell in June with tight supplies of affordable homes limiting first-time buyers, according to the National Association of Realtors®. Total existing-home sales1, which are completed transactions that include single-family homes, townhomes, condominiums and co-ops, declined 5.4 percent to a seasonally adjusted annual rate of 4.37 million in June from an upwardly revised 4.62 million in May, but are 4.5 percent higher than the 4.18 million-unit level in June 2011. Lawrence Yun, NAR chief economist, said the bigger story is lower inventory and the recovery in home prices. “Despite the frictions related to obtaining mortgages, buyer interest remains solid. But inventory continues to shrink and that is limiting buying opportunities. This, in turn, is pushing up home prices in many markets,” he said. “The price improvement also results from fewer distressed homes in the sales mix.”
[continue to bottom of screen to see what’s happening in the Palos Verdes homes market] According to Freddie Mac, the national average commitment rate for a 30-year, conventional, fixed-rate mortgage fell to a record low 3.68 percent in June from 3.80 percent in May; the rate was 4.51 percent in June 2011; recordkeeping began in 1971. The national median existing-home price2 for all housing types was $189,400 in June, up 7.9 percent from a year ago. This marks four back-to-back monthly price increases from a year earlier, which last occurred in February to May of 2006. June’s gain was the strongest since February 2006 when the median price rose 8.7 percent from a year prior. Distressed homes3 – foreclosures and short sales sold at deep discounts – accounted for 25 percent of June sales (13 percent were foreclosures and 12 percent were short sales), unchanged from May but down from 30 percent in June 2011. Foreclosures sold for an average discount of 18 percent below market value in June, while short sales were discounted 15 percent. “The distressed portion of the market will further diminish because the number of seriously delinquent mortgages has been falling,” said Yun. NAR President Moe Veissi, broker-owner of Veissi & Associates Inc., in Miami, said there’s been a steady growth in buyer interest. “Buyer traffic has virtually doubled from last fall, while seller traffic has risen only modestly,” he said. “The very favorable market conditions are helping to unleash a pent-up demand, which is why housing supplies have tightened and are supporting growth in home prices. Nonetheless, incorrectly priced homes will not attract buyers.” Total housing inventory at the end June fell another 3.2 percent to 2.39 million existing homes available for sale, which represents a 6.6-month supply4 at the current sales pace, up from a 6.4-month supply in May. Listed inventory is 24.4 percent below a year ago when there was a 9.1-month supply. First-time buyers accounted for 32 percent of purchasers in June, compared with 34 percent in May and 31 percent in June 2011. “A healthy market share of first-time buyers would be about 40 percent, so these figures show that tight inventory in the lower price ranges, along with unnecessarily tight credit standards, are holding back entry level activity,” Yun said. All-cash sales edged up to 29 percent of transactions in June from 28 percent in May; they were 29 percent in June 2011. Investors, who account for the bulk of cash sales, purchased 19 percent of homes in June, up from 17 percent in May; they were 19 percent in June 2011. Single-family home sales declined 5.1 percent to a seasonally adjusted annual rate of 3.90 million in June from 4.11 million in May, but are 4.8 percent above the 3.72 million-unit pace in June 2011. The median existing single-family home price was $190,100 in June, up 8.0 percent from a year ago. Existing condominium and co-op sales fell 7.8 percent to a seasonally adjusted annual rate of 470,000 in June from 510,000 in May, but are 2.2 percent higher than the 460,000-unit level a year ago. The median existing condo price was $183,200 in June, which is 6.9 percent above June 2011. Regionally, existing-home sales in the Northeast dropped 11.5 percent to an annual pace of 540,000 in June but are 1.9 percent above June 2011. The median price in the Northeast was $253,700, down 1.8 percent from a year ago. Existing-home sales in the Midwest slipped 1.9 percent in June to a level of 1.02 million but are 14.6 percent higher than a year ago. The median price in the Midwest was $157,600, up 8.4 percent from June 2011. In the South, existing-home sales declined 4.4 percent to an annual pace of 1.73 million in June but are 5.5 percent above June 2011. The median price in the South was $165,000, up 6.6 percent from a year ago. Existing-home sales in the West fell 6.9 percent to an annual level of 1.08 million in June and are 3.6 percent below a year ago. The median price in the West was $233,300, up 13.3 percent from May 2011. Given tight supply in both the low and middle price ranges in this region, sales in the West are stronger in the higher price ranges. The National Association of Realtors®, “The Voice for Real Estate,” is America’s largest trade association, representing 1 million members involved in all aspects of the residential and commercial real estate industries. |
|||||||||||||||||||||||||
| As originally published at http://realestatemarbles.com/homeispalosverdes/2012/07/19/palos-verdes-homes-market-changes-vs-national-real-estate/ | |||||||||||||||||||||||||
|
|||||||||||||||||||||||||
|
|||||||||||||||||||||||||


Palos Verdes Real Estate Transaction Report
Palos Verdes Real Estate Transaction Report
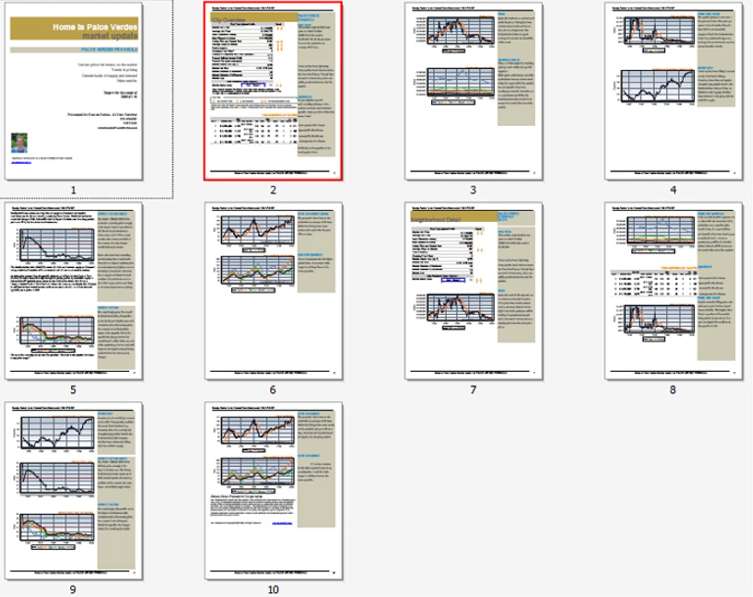
Supply & Demand Study for the last 6 months for the South Bay and the Palos Verdes PeninsulaThe biggest change is in supply. Keep in mind, real estate, as in any other commodity, has it’s price determined by the balance or imbalance in supply and demand. To read the full report and see the changes taking place for the Palos Verdes homes market and the South Bay real estate market, go to the Palos Verdes Homes Supply & Demand Report.
|
|||||||||||||||||||||||||
|
|||||||||||||||||||||||||
|
|||||||||||||||||||||||||


South Bay Pending Sales compared to the West Region of the US
Palos Verdes Real Estate Trends vs the National Housing MarketIt was reported in one of the online trade journals I subscribe to that pending home sales (this is an indicator of “now” activity and measures how buyers “now” are voting with their dollars) have increased yet again. What I would ask that you do is read the article below and then continue on for a more localized report. How are Palos Verdes homes and real estate around the Greater South Bay area faring in relation to these trends? Let’s find out… at the bottom of this article you will see a chart for the South Bay. National Association of Realtors reports Pending Home Sales Up in May, Continue Pattern of Strong Annual Gains Daily Real Estate News | Wednesday, June 27, 2012 Pending home sales bounced back in May, matching the highest level in the past two years, and are well above year-ago levels, according to the National Association of REALTORS®. Both monthly and annual gains were seen in every region.
For more information on real estate trends for the Palos Verdes homes market please go here.
|
|||||||||||||||||||||||||
| originally posted at http://realestatemarbles.com/homeispalosverdes/2012/06/27/south-bay-home…tern-us-region | |||||||||||||||||||||||||
|
|||||||||||||||||||||||||
|
|||||||||||||||||||||||||


Palos Verdes Real Estate market keeping pace with National Trends?
Will the Palos Verdes Real Estate Market follow National Trends?You may hear the video near the bottom of this post, start to play immediately. To stop it, just scroll down and click the pause key. You can return to it later after reading this post. In the trade journal, “Realty Mag”, there was an article in which 5 projections were made as to where the housing market is headed. Real estate markets across the country are inching their way to a slow recovery after bottoming out, according to several real estate economists who spoke at a forum hosted by the National Association of Real Estate Editors. National Association of REALTORS®’ Chief Economist Lawrence Yun, Zillow Chief Economist Stan Humphries, and National Association of Home Builders Chief Economist David Crowe shared their views on the direction of the housing market during the forum. “Last year was the worst year on record for [new] house sales, for 60 years of housing-sale info,” Crowe said. But things are picking up, the economists note, despite several challenges still threatening that recovery. Yun says that appraisal issues are holding back up to 20 percent of home sales and that lenders’ tightened mortgage underwriting standards are likely holding back another 15 to 20 percent of potential home deals. Here are some of the economists’ forecasts: 1. New-home market: The NAHB predicts a 19 percent increase in single-family housing starts this year over last (from 434,000 last year to a projected 516,000 this year). 2. Single-family rental market: This could be the next housing market bubble, Humphries warns. He expects this sector to cool as rental rates continue to increase and as home ownership looks more attractive to the public again. 3. Distressed home sales: The percentage of distressed homes sales is projected to drop by 25 percent in 2012 and 15 percent in 2013, Yun says. 4. Home price appreciation: Yun says it’s possible some markets may see a 10 percent rise in home-price appreciation next year due to an increase in demand, or a 60 to 70 percent increase in housing starts. Yun argues it won’t be both, however, but rather one or the other. He notes it greatly depends on whether lawmakers reach an agreement once again on the looming debt-ceiling deadline. 5. Home owners’ negative equity: About a third of home owners are underwater, owing more on their mortgage than their home is currently worth. As such, the housing recovery will likely be “stair stepped,” Humphries says. He says home owners with negative equity will gradually begin to list their homes as they see prices inch up, but when they do, that may temporarily swell the housing supply and cause a brief pause to the recovery. There was further discussion in that article about a study done by the Harvard Joint Center for Housing Studies that showed some interesting trends going on right now. I wondered if we would see the same pattern for the Palos Verdes homes market Beginning in mid-2008, mortgage payments were cheaper than rents
As of today, the median sale price of a home sold on the Palos Verdes Peninsula in the last 3 months is $1,200,000. With 25% down payment, and today’s interest rates for a 30 year fixed rate loan being about 4.275%, your monthly PITI (principle, interest, taxes and insurance would be around $5,791/mo. The median rent paid for a Palos Verdes home in the last 3 months is $4,147/mo. Palos Verdes is not following the national trends in this regard. For more information from my “newsroom” play this video
|
|||||||||||||||||||||||||
|
|||||||||||||||||||||||||
|
|||||||||||||||||||||||||

Latest Palos Verdes Real Estate Trends
|
As you can see by the graph here, my proprietary supply/demand chart predicted the real estate slow down by about 18 months. What’s the chart telling us now? Click on the chart to view a larger picture by signing up for my proprietary charts. If you fill out this brief “sign in” page with your information (this will remain private, I promise you, your information will not be sold, shared or distributed to anyone!), you will receive the link to these pivotal charts and key information to study at your leisure. The information is proprietary and is intended for your use only. Making copies or redistributing the link to others is expressly forbidden without prior permission. The information is intended ONLY for existing and potential clients; not for other real estate professionals (except as a fee based service) Thank you for understanding. Please provide a VALID email address to which I can email you the link for the charts. Thank you. This does NOT result in an automated responder, but rather a live email from me personally. Therefore, again, a VALID email address is required. This information is intended ONLY for existing clients or those considering becoming a client. Thus, all the information below must be completed correctly. Rest assured, I hate spam as much as or more than you, so I promise NEVER to share your information with anyone. Once verified, I look forward to sharing with you the link to my proprietary charts.
For more information on homes for sale in Palos Verdes, Palos Verdes real estate, palos verdes homes for sale, palos verdes foreclosures, palos verdes real estate market information as well as quality information on homes for sale in Rancho Palos Verdes, Palos Verdes Estates homes for sale, Manhattan Beach real estate, Hermosa Beach real estate, Redondo Beach real estate, Torrance real estate, Palos Verdes real estate trends, and real estate trends throughout the Beach Cities, Palos Verdes Estates and the South Bay, visit www.homeispalosverdes.com
DRE LIC # 785373
|
|||||||||||||||||||||||||
|
|||||||||||||||||||||||||
|
|||||||||||||||||||||||||

 Real estate is no different than any other commodity; whether we’re talking about gold, silver, lumber or pork belly futures. Real estate is yet another commodity ruled by the economic laws of supply and demand.


Palos Verdes Real Estate Trends – South Bay sale volume BREAKOUT
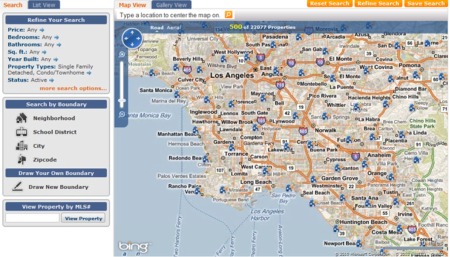
Palos Verdes Homes for sale3 Home Search Tools that are FREEI’ve developed 3 search tools that you are welcome to use when searching for Palos Verdes homes for sale or any homes for sale around the South Bay area. Use all three if you wish. Each have their own distinct benefits, so I won’t presume to suggest which one is best for you. Try them all and see which you prefer To start, go to my website at www.homeispalosverdes.com. Play this video for a brief overview on each of the tools. Feel welcome to contact me if you need any help; I can even set up a “Go To Meeting” online private webinar for you if you want to see any or all of these search tools in action. That way, you can become expert at searching through the multiple listing service almost as if you were an agent yourself! While you’re at it, you might be interested in learning about some major changes that are occurring in the real estate market for the South Bay. Don’t assume the market today is like it has been over the last 3 years. Here’s proof based on FACTS as to why I’m making that representation. If you would like to gain access to my proprietary charts AND you are NOT an agent AND you are willing to consider choosing me to represent you on the sale or purchase of real estate here in the South Bay/ Palos Verdes real estate areas, then go to this Palos Verdes Real Estate Transactions and South Bay Trend Charts site |
|||||||||||||||||||||||||
|
|||||||||||||||||||||||||
|
|||||||||||||||||||||||||
