Palos Verdes Foreclosures Updated 9/17/2013 (Go to bottom of page to view macro economic foreclosure information)
Some data may not display here properly; Original Content posted here: George Fotion, HomeIsPalosVerdes.com
For more information on specific foreclosure properties, please visit Palos Verdes Foreclosures and South Bay Foreclosures Email or call for more detailed charts OR for charts specific to your city. Added note, the last chart is the most interesting for investors. Let me know if you have questions!
INVESTORS – Are you aware of how to benefit from “Short Sales”?
IF you would like more charts for your own city, just let me know… For each city, the following charts are available…. number of filings, outcomes, inventories, bid results, timeframes, by square foot, by year built, by loan balance, bedrooms, by estimated market value, by loan origination date, and foreclosure discounting…


Review the latest Palos Verdes Foreclosures trends, use our directory of California counties to see local foreclosure trends or search foreclosure listings for any City or ZIP code in the state. Our California housing and demographics data will help you understand the California real estate market. For more information on specific foreclosure properties, sign up for my Palos Verdes Foreclosures search utility Palos Verdes Foreclosures Filings—Notice of Default filings are the first step in the foreclosure process. Notice of Trustee Sale filings set the date and time of an auction, and serve as the homeowner’s final notice before sale.
Palos Verdes Foreclosures charts

Palos Verdes Foreclosures Outcomes—After the filing of a Notice of Trustee Sale, there are only three possible outcomes. First, the sale can be Cancelled for reasons that include a successful loan modification or short sale, a filing error, or a legal requirement to re-file the notice after extended postponements. Alternatively, if the property is taken to sale, the bank will place the opening bid. If a 3rd party, typically an investor, bids more than the bank’s opening bid, the property will be Sold to 3rd Party; if not, it will go Back to the Bank and become part of that bank’s REO inventory.

Palos Verdes Foreclosures Inventories—Preforeclosure inventory is an estimate of the number of properties that have had a Notice of Default filed against the property, but have not yet been Scheduled for Sale. The Scheduled for Sale inventory indicates those properties that have had a Notice of Trustee Sale filed, but have not yet been sold or had the sale cancelled. The Bank Owned (REO) inventory indicates the number of properties that have been sold Back to the Bank at the trustee sale, and which the bank has not yet resold to another party.

Palos Verdes Foreclosures Bids—The Published Bid is the amount listed in the Notice of Trustee Sale and is typically the balance due at the original date of sale. The Opening Bid is the bank’s starting bid at auction, and is often discounted from the Published Bid. The Winning Bid is the highest bid received at auction and reflects the amount at which the bank or 3rd party purchased the foreclosure.

Palos Verdes Foreclosures Discounting—This chart compares the winning Bid Amount of properties sold at trustee sale to both the outstanding Loan Amount, and the current Market Value. Banks place an Opening Bid for each property and if a 3rd Party does not make a higher bid, the property will be sold Back to Bank (REO) for the Opening Bid amount. Properties Sold to 3rd Parties will typically have Winning Bids with deeper discounts to both Loan Amount and Market Value as only low Opening Bids will attract investor interest. NO DATA AVAILABLE THIS MONTH
Time to Foreclose—The average number of days between the filing of the Notice of Default and the final sale at auction for foreclosure sales that occurred during the specified month. Time to Resell—The average number of days between the final sale at auction and when the property was resold by the bank or 3rd party.

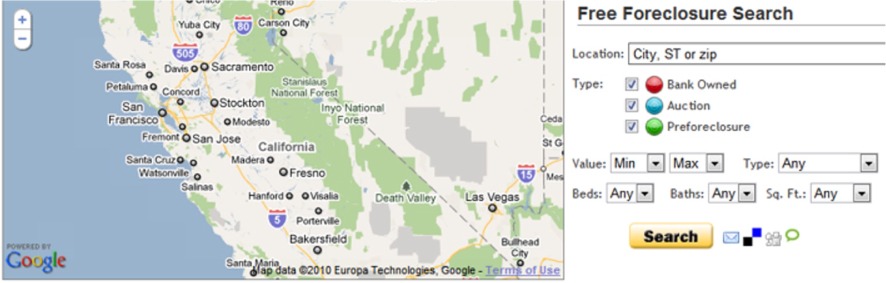
Easy tool to find Palos Verdes Foreclosures Homes for Sale
Go to original content page http://www.homeispalosverdes.com/palos-verdes-foreclosures-report/
California August foreclosure sales fell 5.5 percent from July. Despite August’s decline, foreclosure sales have been trending mostly sideways since May. The bottom-bouncing trend reflects the recovery in the California real estate market and the overall decline in the pipeline of Notices of Default (NODs) and Notices of Trustee Sale (NTS).
Splitting August foreclosure sales into their respective components — Sold to Third Party and Back to Bank (REO) — Sold to Third Party sales fell 19.7 percent in August while REOs surged 7.2 percent. Beginning in the later part of July, several of the largest banks resumed foreclosure sales following a temporary pause due to an Office of the Comptroller of the Currency (OCC) guidance letter that specified minimum standards for handling borrower files subject to foreclosure. Over the past 12 months, Sold to Third Party and REO sales are down 69.4 percent and 72.3 percent, respectively.

Notices of Default (NODs) in California dipped 0.7% in August and fell 55.0 percent for the year. Notices of Trustee Sale (NTS) were up 3.1 percent for the month but down 50.6 percent for the year.
In general, foreclosure inventories continue to decline, mirroring the NOD and NTS trends. Preforeclosure inventories rose 8.0 percent in August but have fallen 47.0 percent for the year. Scheduled for Trustee Sale inventory fell 1.6 percent for the month and is down 71.5 percent for the year. Bank Owned (REO) inventory was nearly unchanged for the month, edging down 0.9 percent in August and sliding 32.4 percent for the year.

Foreclosures have declined over the past year because:
-
The California real estate recovery and the low inventory of homes for sale have pushed home prices higher, reducing the number of homeowners who owe more than their homes are worth and making them eligible to refinance or sell their homes.
-
The California Homeowner Bill of Rights prevents dual-tracking, which is lengthening the time to foreclose.
Since the beginning of summer, however, there has been a noticeable decrease in the rate of decline as the foreclosure market approaches a more normal foreclosure-activity state.
August Foreclosure Stats & Trends, by State
For a complete summary of August foreclosure stats and trends, please click on the following links:
Note: The numbers in parentheses indicate over-the-month changes.
California foreclosure stats and trends
Foreclosure starts: 7,970 (-0.7%)
Foreclosure sales: 2,818 (-5.5%)
//

+George Fotion
George Fotion on Google+
Original Content posted here: George Fotion, HomeIsPalosVerdes.com